

Effective user stories are the foundation of successful agile product development. However, large, vague stories lead to delayed delivery, unclear progress, and stakeholder frustration.
This guide outlines ten proven techniques for splitting user stories into smaller, more manageable pieces that can be delivered incrementally, providing value faster while maintaining clarity throughout the development process.
When to split a user story:
- When it can’t be completed in a single sprint
- When progress is difficult to measure
- When testing becomes overly complex
- When stakeholders struggle to understand the current status
- When the story contains multiple user journeys or business rules
Workflow
A workflow is a sequence of steps that users follow to complete a task. Splitting workflows means breaking end-to-end processes into smaller, testable units of value.
Scenario:
Your team is building an order fulfillment system. The product owner writes:
“As a customer, I can purchase items so I can receive my order.”
But this bundles:
- Browsing products
- Checkout
- Payment
- Shipping
- Notifications
Why Workflow Splitting Matters
When workflows aren’t split:
🚫 Slow delivery (Nothing works until everything works)
🚫 Unclear progress (“Is checkout 50% done or 80% done?”)
🚫 Testing nightmares (Too many moving parts at once)
The Solution: Step-by-Step Delivery
Break workflows into small, testable steps for faster shipping and learning.
Before:
“As a user, I can complete an online purchase.” (Too broad)
After (split by workflow steps):
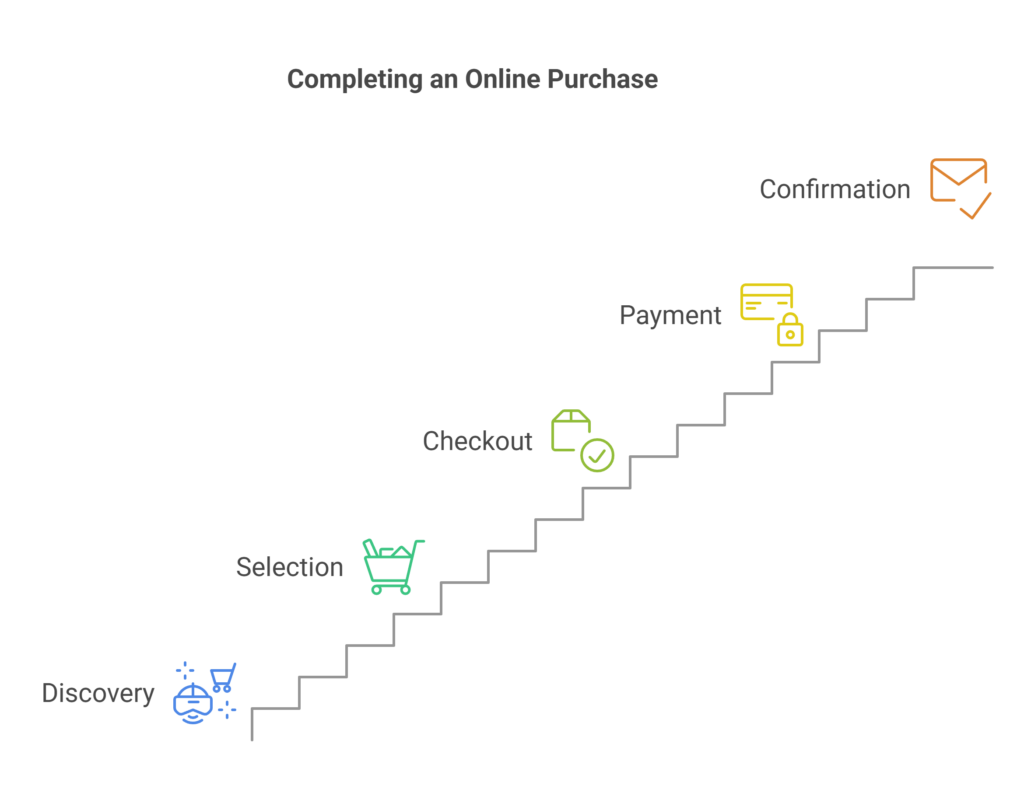
1️⃣ Discovery:
“As a shopper, I can browse products with filters so I can find what I need.”
2️⃣ Selection:
“As a customer, I can add items to my cart so I can review them before buying.”
3️⃣ Checkout:
“As a buyer, I can enter shipping details so my order can be delivered.”
4️⃣ Payment:
“As a customer, I can pay securely so my order is confirmed.”
5️⃣ Confirmation:
“As a buyer, I receive an order confirmation email so I know my purchase succeeded.”
Pro tip:
- Identify “happy path” steps first (Core functionality before edge cases)
- Map dependencies (Can’t confirm orders before payments work)
- Use workflow diagrams to visualise splits during refinement
Business Rule Variations
Business rules are the conditions and policies that determine how a system behaves (e.g., approvals, calculations, access control).
Scenario:
Your team is building a loan application system. The product owner says:
“As a loan officer, I want applications processed automatically.”
But hidden underneath are dozens of rules:
- Credit score thresholds
- Income verification
- Fraud detection
Why Business Rule Splitting Matters
Business rules often get bundled into monolithic user stories.
This leads to:
🚫 Scope creep (“We forgot about co-signers!”)
🚫 Testing gaps (Missed rule combinations)
🚫 Brittle code (Tightly coupled logic)
The Solution: Rule-by-Rule Delivery
Break complex logic into standalone stories
Before:
“As a loan officer, I want automatic application approval.”
(Too vague – hides all complexity)
After (split by different rules):
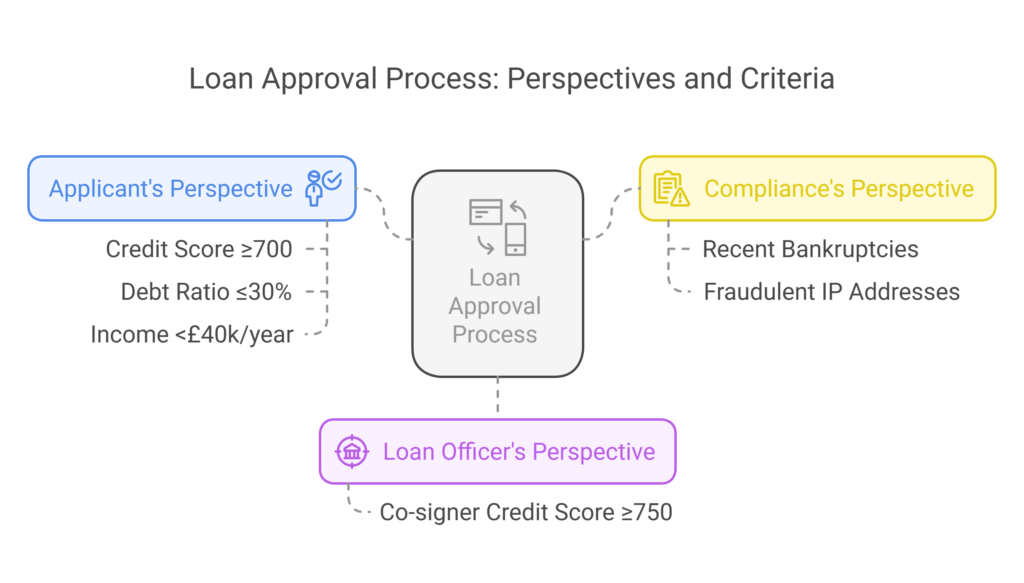
1️⃣ Applicant’s Perspective:
“As a loan applicant, I want instant approval when I meet all criteria so I can get funds quickly.”
Acceptance Criteria:
- Approved if credit score ≥700 and debt ratio ≤30%
- Flagged for review if income <£40k/year
2️⃣ Loan Officer’s Perspective:
“As a loan officer, I want to override auto-rejects when applicants have co-signers so I don’t miss good candidates.”
Acceptance Criteria:
- Show override option when co-signer credit score ≥750
3️⃣ Compliance’s Perspective:
“As a compliance officer, I want high-risk applications flagged so we avoid fraud.”
Acceptance Criteria:
- Flag if applicant has recent bankruptcies
- Flag if IP address matches known fraud patterns
Pro tip:
- Identify atomic rules based on roles, events and triggers (Applicants, officers, admins)
- Separate core logic from exceptions
- Use decision tables to visualise rule combinations
Effort-Based
Effort-based splitting breaks down work by complexity and implementation time, ensuring each story is small enough to complete in a single sprint.
Scenario:
Your team estimates a “simple” user profile feature at 3 days.
Two sprints later:
- The bio field crashes on emojis 😅
- Avatars aren’t cropping right
- Social links won’t save
Why Effort Splitting Matters
When stories combine simple and complex work:
🚫 Estimates become unreliable (“This should be quick” turns into scope creep)
🚫 Teams lose momentum (No visible progress for weeks)
🚫 Stakeholders panic (“Why isn’t this done yet?”)
The Solution: Split by Complexity
Break complex logic into independent and testable steps.
Before:
“As a user, I can customise my profile.” (Too complex)
After (split by effort/complexity):
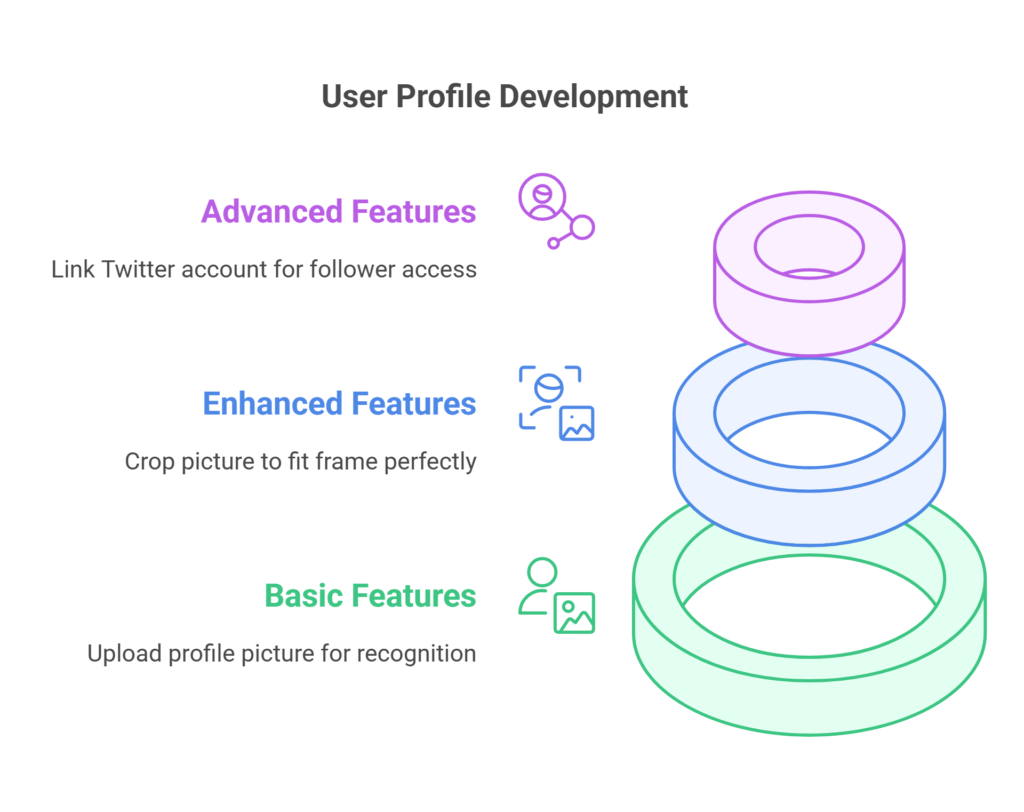
- 1️⃣ Basic “As a user, I can upload a profile picture so others can recognise me.”
- 2️⃣ Enhanced “As a user, I can crop my picture so it fits perfectly in the frame.”
- 3️⃣ Advanced “As a user, I can link my Twitter account so my followers can find me there.”
Pro tip:
- Ask “What’s the bare minimum?” for initial delivery
- Use spike stories to investigate complex pieces first
- Visualise effort before committing
4. Multiple Scenarios
A multi-scenario user story describes a single feature that must support multiple paths users can achieve the same goal.
Scenario: You’re building a login system with your team. The Product Owner casually says, “Just support email, Google, and Facebook login.” It sounds simple enough, so you get started.
Your team is building a login system. The product owner says:
“As a user, I can log in to the app.”
But hidden underneath are:
- Two-factor authentication
- Email/password login
- Google OAuth
- Password recovery
Why Scenario Splitting Matters
When you bundle multiple use cases together:
🚫 Development drags on (Can’t ship until ALL auth methods work)
🚫 Testing becomes a nightmare (Exponential test cases)
🚫 Critical paths get blocked (Facebook API issues delay the whole feature)
The Solution: Isolate and Conquer
Split by independent user journeys.
Before:
“As a user, I can log in to the system.” (Broad)
After (split by different scenarios):
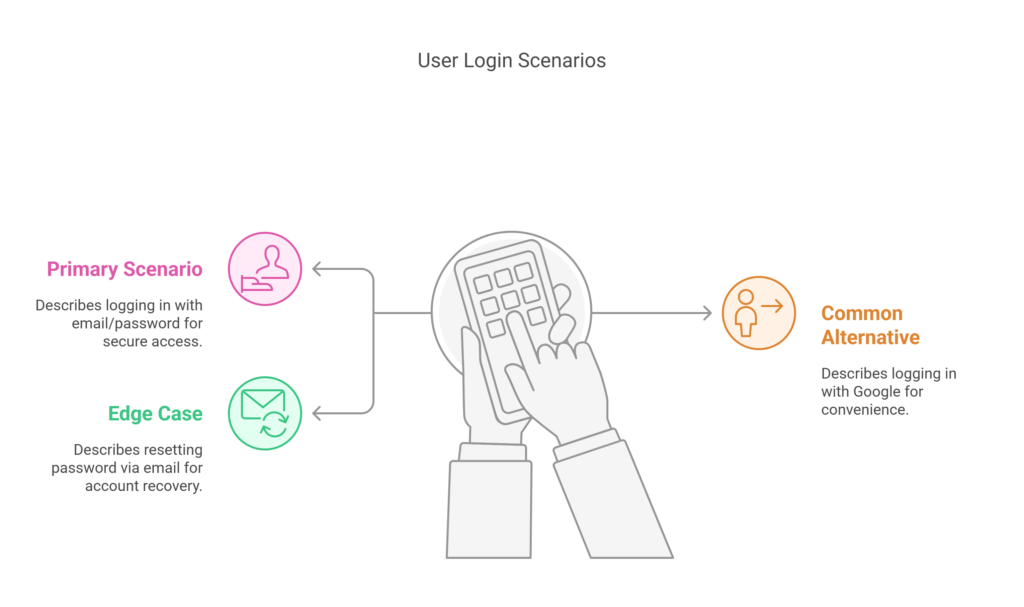
1️⃣ Primary Scenario:“As a user, I can log in with email/password so I can access my account securely.”
2️⃣ Common Alternative:“As a user, I can log in with Google so I don’t need to remember a password.”
3️⃣ Edge Case: “As a user, I can reset my password via email so I can recover a locked account.”
Pro tip:
- Map all scenarios first using event storming or user journey mapping
- Identify the straightforward scenarios i.e. happy path and create a story for it.
- Identify the alternative scenarios and create a story for it.
5. Role-Based
Definition:When admins, regular users, and guests all use the system in their own way, you need to build separate interfaces for each of them.
Scenario: Your team’s building a dashboard feature. A stakeholder says, “All users should see the same data.” Simple, right? Fast forward two months, and you’re knee-deep in debates about admin permissions and who should see what
This is why role-based splitting is crucial for delivering the right features to the right users.
Why Role-Based Splitting Matters
When you treat all users the same:
🚫 Features become bloated (Trying to please everyone pleases no one)
🚫 Security risks emerge (Accidental admin access for regular users)
🚫 Development slows down (Constant rework for different permission levels)
The Solution: Build for Roles, Not Generic Users
- Split features by user types and permission to simply testing (each role has clear expectations).
Before:
“As a user, I can manage account settings.” (Unclear roles)
After (split by user roles):
- “As an admin, I can suspend user accounts.”
- “As a regular user, I can update my profile details.”
- “As a guest, I can register for an account.”
Pro tip:
- Conduct role mapping workshops before development begins
- Implement role-based feature flags for safe experimentation
- Use persona testing to validate each role’s experience
6. Data Segmentation
Definition: A large work item that involves data complexity and data analytics.
Scenario: The manager storms into your standup. “Why can’t I see our Q3 sales trends by region yet? The board meeting is tomorrow!” Your team has been working on “the reports feature” for weeks, but it’s stuck in development hell – trying to build a monolithic dashboard that shows everything to everyone.
This is why data segmentation separates the analytics heroes from the spreadsheet sufferers.
Why Data Segmentation is Non-Negotiable
When you treat data as one giant blob:
🚫 Performance tanks (Users wait 45 seconds for a report to load)
🚫 Insights get lost (Important metrics buried in noise)
🚫 Development stalls (Waiting for “perfect” data pipelines)
The Solution: Surgical Data Delivery
Before:
“As a user, I can view reports.” (Too generic)
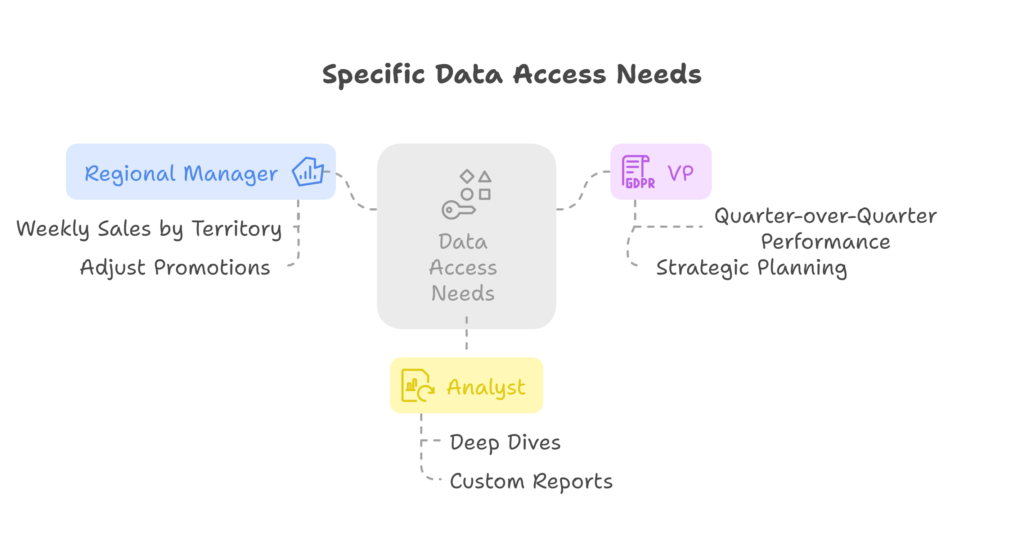
After (split by data types):
- “As a regional manager, I need to see weekly sales by territory to adjust promotions“
- “As a VP, I need to compare department performance quarter-over-quarter”
- “As an analyst, I need custom export options for deep dives”
Pro-tip: Create a data decision matrix with stakeholders to prioritise by:
- Decision impact
- Frequency of use
- Time sensitivity
7. CRUD Operations
Definition: CRUD operations often hide as single backlog items containing multiple, distinct user goals under vague verbs like “manage.
Scenario: Your team is building a content platform. The ticket says: “As a user, I can manage my posts.” Two weeks later, you’re stuck in endless scope debates—does “manage” include archiving? What about version history? The sprint’s almost over and nothing’s shippable.
Why “Manage” is a Trap
When stories use umbrella terms like “manage”:
🚫 Scope explodes (“Does this include analytics? Moderation?”)
🚫 Testing fails (Miss edge cases between operations)
🚫 Users wait longer (Nothing works until everything works)
The Solution: Split by Atomic Actions
Before:
“As a user, I can manage my blog posts.” (Too broad)
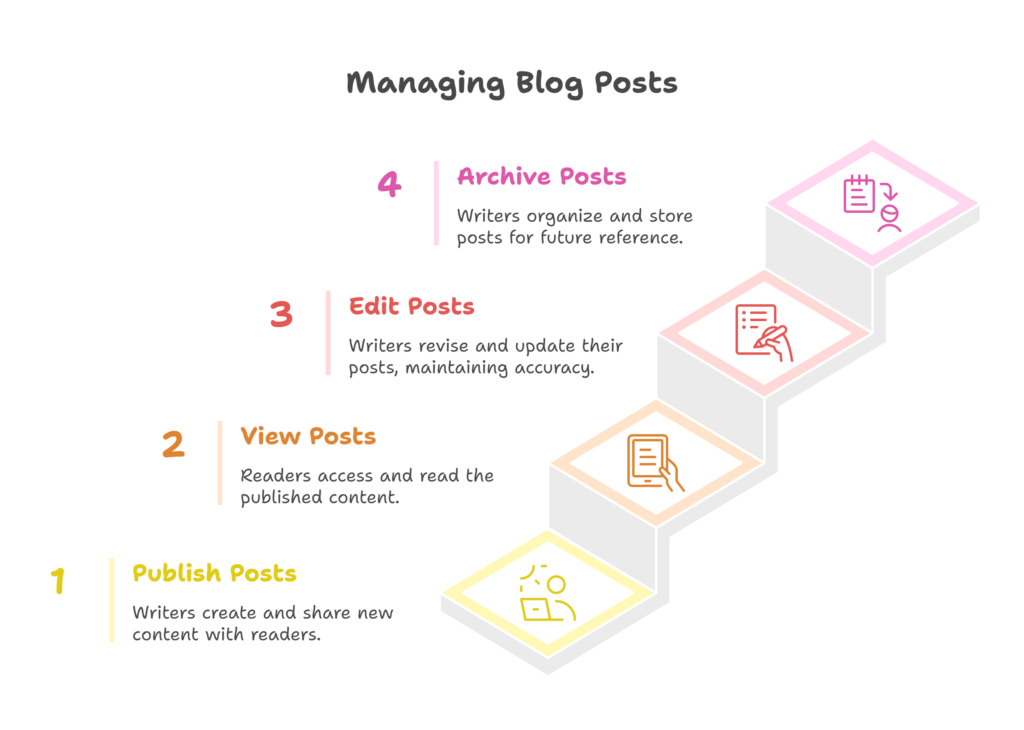
After (split by CRUD actions):
- “As a writer, I can publish new posts.” (Create)
- “As a reader, I can view published posts.” (Read)
- “As a writer, I can edit my posts with revision history.” (Update)
- “As a writer, I can archive posts with recovery options.” (Delete)
Pro- tip:
- Spot “manage” in your requirements– It’s a splitting trigger
- Use semantic verbs (Create/View/Edit/Archive > “Manage”
8. Uncertainty (Spikes)
Definition: A spike is a time-boxed research story used to explore solutions, reduce uncertainty, and gather data before committing to implementation.
Scenario: Your team just got asked to integrate a payment gateway. “We need this done by Friday,” says the Product Owner. But when you open the API docs, you hit three critical unknowns in the first hour. Now what?
This is why spike stories exist: to turn “We’re stuck” into “We’ve got answers” in hours, not weeks.
Why Spikes Matter
When you ignore unknowns:
🚫 Daily standups become awkward (“Still reading docs…”)
🚫 Deadlines get missed (Hidden complexity emerges)
🚫 Quality suffers (Rushed workarounds create tech debt)
The Solution: Pause, Research, Then Build
Before:
“As a developer, I need to integrate a payment gateway.” (Too risky, unknown effort)
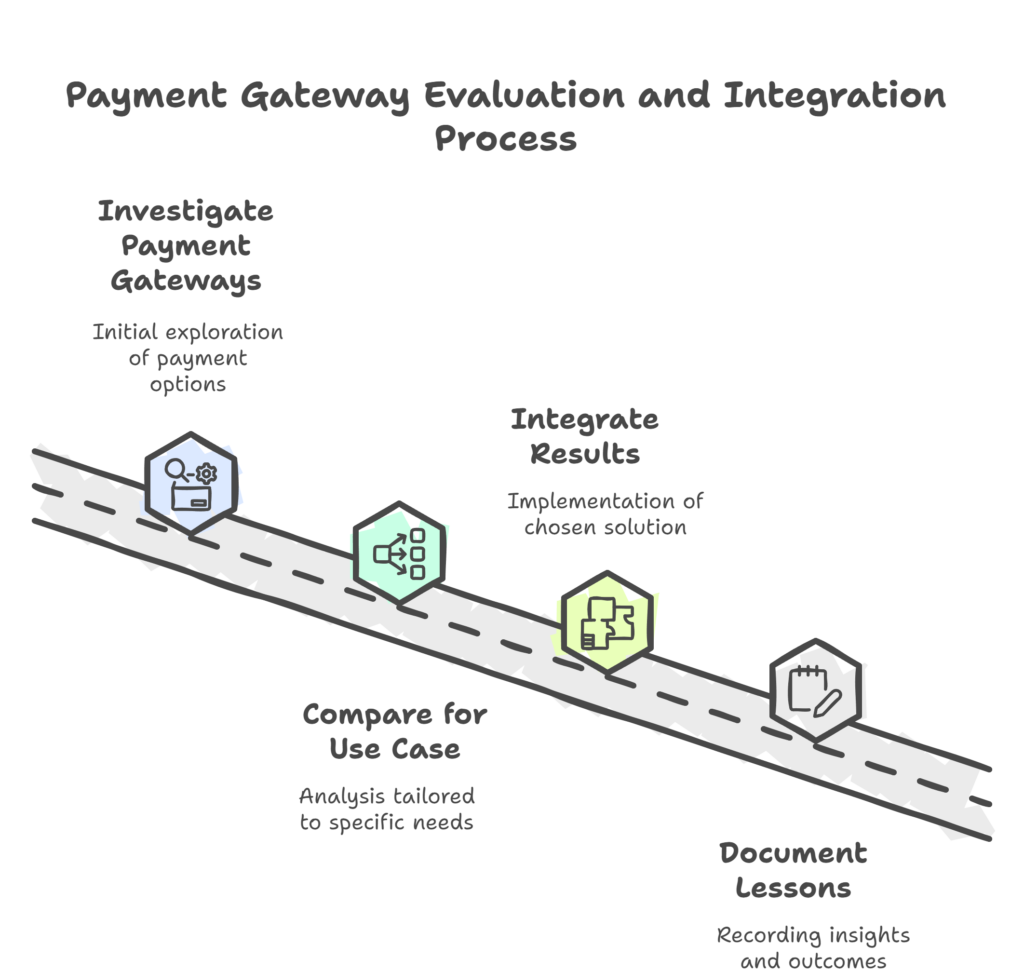
After (split into research + implementation):
- “Investigate available payment gateways (Stripe vs. PayPal).” (Spike)
- “Compare Stripe vs PayPal for our use case” (Output: Decision matrix with recommendation)
- “Integrate results from the usecase for credit card payments.” (After research)
- Document the lessons learnt
Pro-tip: Schedule spike reviews right after lunch – fresh minds digest findings better
9. Integration Points
Definition: integration points are specific connections between your system and external services/APIs that exchange data or functionality.
Scenario: Your team is asked to “sync data with external services.” Two days later, you’re drowning in API docs, auth errors, and rate limits—with no working integration. This is why integration splittng is key because it turns a vague, overwhelming task into clear, actionable steps.
Why Integration Splitting Matters
When you bundle all integrations into one story:
🚫 Scope explodes (“Wait, which services are we even connecting?”)
🚫 Testing becomes impossible (Too many variables at once)
🚫 Nothing ships (Blocked on one broken API? Everything stalls)
The Solution: Split by System
Before:
“As a system, I need to sync data with external services.” (Too vague)
After (split by integration types)
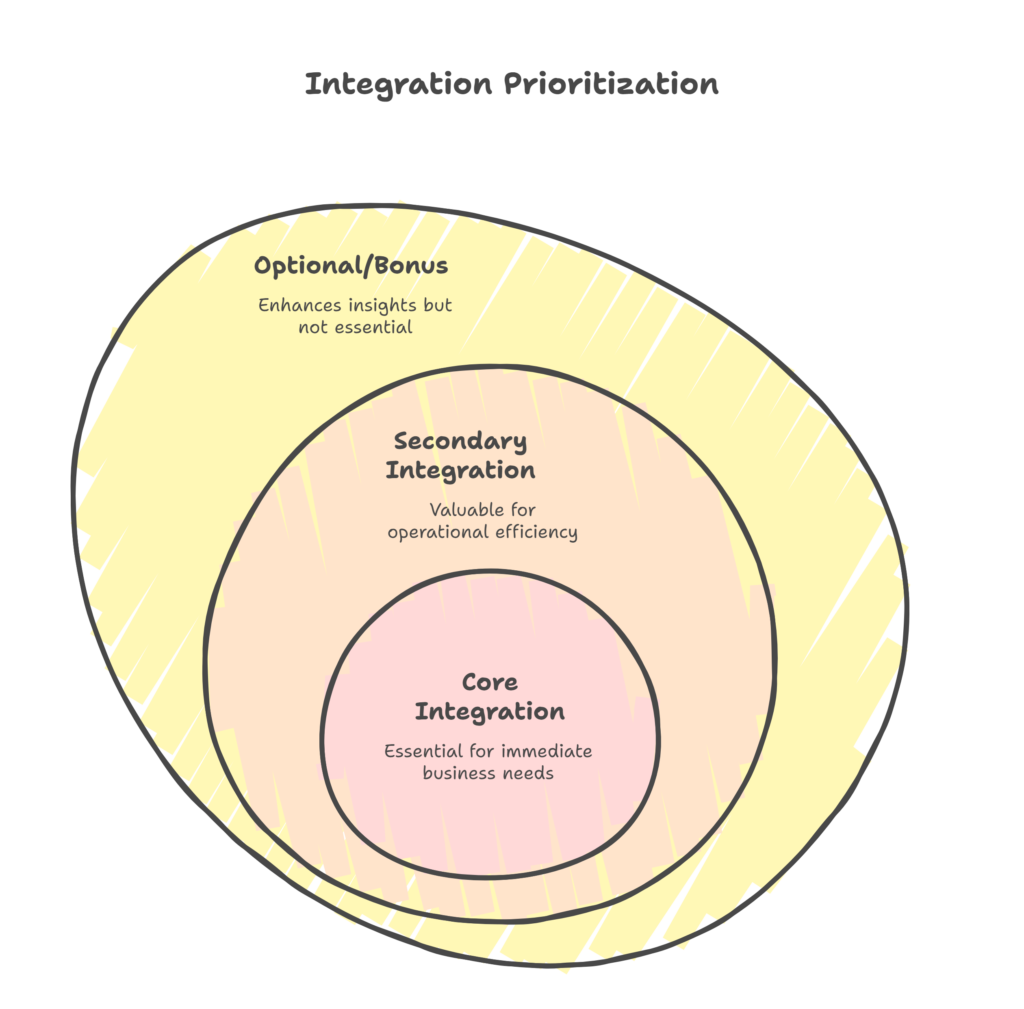
1. Core Integration (Highest Value First):
“Sync customer data from Salesforce (read-only).”
(Start with the most critical business need)
2. Secondary Integration:
“Sync product inventory with Shopify.”
(Next most valuable connection)
3. Optional/Bonus:
“Pull campaign metrics from Google Analytics.”
(“Nice-to-have” after core integrations work)
Pro-tip:
- Isolate by system – One integration per story (e.g., “Sync Salesforce contacts,” not “Sync all external data”)
- Prioritise read-first – Start with unidirectional syncs (safer than two-way) before adding complexity
- Decouple dependencies – Ensure each integration works independently (no chain reactions if one fails)
- Create a separate User Story for integration with each entity
Device
Definition :Device splitting is the practice of separating user stories by device type (desktop, mobile, tablet) or technical constraints (iOS vs Android, browser vs native) to ensure optimal user experiences across platforms.
Scenario: Your designer proudly delivers mockups for the “perfect responsive dashboard.” But when development starts:
• Mobile interactions break on touchscreens
• Desktop users get a dumbed-down experience
• QA finds 47 viewport-specific bugs
Why Device Splitting Matters
When teams build “one-size-fits-all” solutions:
🚫 UX suffers (Mobile users pinch-zoom, desktop users see empty whitespace)
🚫 QA effort explodes (Testing every device combination)
🚫 Performance tanks (Heavy desktop assets load on mobile)
The Solution: Right-Sized Device Stories
Split work by device needs (not just screen size)
Before:
“Implement dashboard for all devices”
(Leads to compromised experiences everywhere)
After (Strategic Approach):
1. Core Mobile Experience:
“As a mobile user, I can view key metrics in a scrollable card layout”
2. Enhanced Desktop Version:
“As a desktop user, I can use interactive charts with hover details”
3. Cross-Platform Consistency:
“Ensure color contrast meets WCAG standards on all viewports”
Pro-tip:
- Prioritise by user base (Start with your most-used device)
- Separate technical implementations (Native vs. web, iOS vs. Android)
- Create stories that cater to the various devices