
Why Do 90% of Startups Fail? (The Wrong Metrics Problem)
You can pour months, even years, into building something you’re genuinely proud of—only to find out it’s not what anyone needed in the first place.
That’s the painful truth behind most startup failures. And it’s rarely because the team didn’t work hard. More often, it’s because they focused on the wrong things—especially the wrong metrics.
As a product manager, your biggest advantage is making smart, data-informed decisions.
But here’s the thing: not all data is useful. Metrics like total sign-ups or page views might look good on a slide deck, but they won’t tell you if your users care about what you’ve built—or if your business can survive.
What You’ll Get From This Guide
We’re going straight to the metrics that matter—the ones that actually help you build and grow a SaaS product people love.
You’ll learn:
- The core metrics every PM should track (and what they actually tell you)
- How teams at companies like Slack, Amazon, and Notion used metrics to guide growth
- The common traps to avoid—like chasing vanity numbers or reading data the wrong way
Why It Matters
Whether you’re launching a v1 or scaling something that’s already working, understanding the right metrics can mean the difference between making progress and spinning your wheels.
By the end, you’ll know which numbers are worth your attention—and how to use them to make better product decisions.
The Metrics That Actually Matter for Your SaaS Product
Here’s something I learned early in my PM journey (the hard way): not all metrics are helpful. Some look great in a slide deck, but when it comes to making actual product decisions, they’re pretty useless.
The key difference? Vanity metrics vs. actionable metrics.
Spotting the difference early can save you from chasing numbers that look good—but lead nowhere.
The Seduction of Vanity Metrics
We’ve all been tempted by vanity metrics – those big, beautiful numbers that look impressive in reports but don’t actually help us improve our product. These numbers are like counting gym memberships instead of tracking actual workouts.
They make for great PR but terrible product decisions.
The Vanity Metric Trap
We’ve all celebrated the wrong milestones:
- “10,000 sign-ups!” (But how many are active?)
- “1 million page views!” (Are users actually engaging?)
- “50,000 downloads!” (Do they keep using the product?)
The problem?
These metrics give you the dopamine hit of growth without the substance of sustainable success. That “10,000 new users” milestone feels great until you realise 90% churned after their first session.
The Power of Actionable Metrics
Actionable metrics are different. They have three superpowers:
- They guide your next step (e.g. “activation is low—time to fix onboarding”)
- They tie back to business goals (like retention or revenue)
- They reflect actual user behavior (not just potential interest)
Take activation rate (the percentage of users who complete a key “aha moment”). When Slack tracked how many teams sent 2,000 messages (their activation benchmark), they could actually predict long-term retention.
Other SaaS teams have done the same—zeroing in on the actions that actually matter for their product’s success.
- Trello looked at how many boards a user created. Turns out, if someone set up at least one board in their first week, they were way more likely to stick around.
- Dropbox tracked how many files new users saved. Just saving one file early on was a strong signal they’d keep using it.
- Zoom focused on meetings. If a user hosted even one meeting in their first week, chances were high they’d keep coming back.
In each case, these teams used real behavior—not just sign-up counts—to figure out what “success” looked like early in the journey. Then they designed their onboarding and product experience to nudge users toward those key moments.
How Your Key Metrics Should Evolve With Your Business
One of the biggest mistakes I see teams make is sticking with the same metrics from launch through to scale. But as your product grows, your metrics need to grow with it.
Stage 1: Finding Product-Market Fit (0-1k users)
When you’re just starting out, your entire focus should be answering one burning question: Are we solving a real problem for real people?
At this stage:
- Track engagement depth over user count (10 passionate users > 1,000 passive signups)
- Measure frequency of use – are people coming back naturally?
- Collect qualitative feedback like your life depended on it (why they stay, why they leave)
As the Lean Startup teaches us, this is your validation phase. I’ve seen too many teams waste months optimising for scale before proving anyone actually wants their product.
Stage 2: Growth (1,000–10,000 users) — Can we scale this?
Once you’ve nailed product-market fit, the next question is: Can this actually grow into a healthy business? That means shifting your focus to a few key metrics that reveal whether your growth is sustainable.
Here’s what to keep an eye on:
- Churn Rate – How many customers are leaving each month?
Example: If 5 out of 100 users leave, that’s 5% churn. Too high, and you’ve got a leaky bucket. - Customer Acquisition Cost (CAC) – How much are you spending to get a new customer?
Example: If you spend £10,000 on marketing and get 100 customers, your CAC is £100. - Lifetime Value (LTV) – How much revenue does the average customer bring in over time?
Example: If someone pays £50/month and sticks around for 10 months, LTV is £500.
You want your LTV to be significantly higher than your CAC—otherwise, you’re spending more to acquire users than they’re worth. Growth without a strong foundation here just burns money.
One More Thing: LTV to CAC Ratio
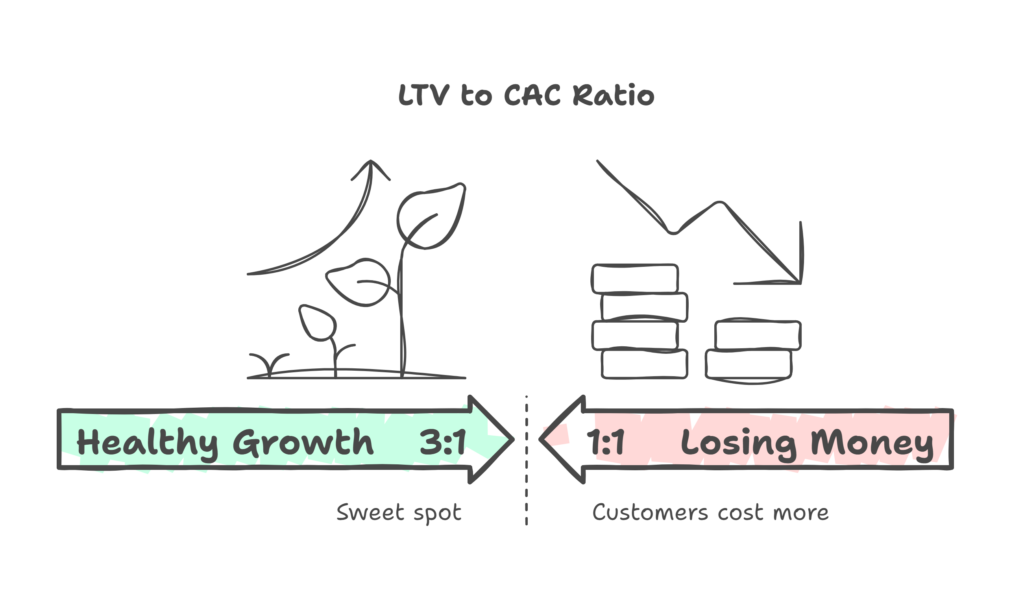
Once you’re tracking CAC and LTV, the next step is understanding how they relate. That’s where the LTV:CAC ratio comes in—it shows how efficiently you’re turning marketing spend into long-term value.
Here’s a quick breakdown:
- < 1:1 – You’re losing money. Customers cost more than they’re worth.
- 1:1 to 2:1 – You’re barely breaking even. Not great.
- 3:1 – This is the sweet spot. Healthy growth, solid margins.
- > 4:1 – Sounds good, but could mean you’re being too conservative with spend—you might have room to scale faster.
As a rule of thumb, aim for a 3:1 ratio. It strikes a good balance between efficient acquisition and smart reinvestment.
Why Slack Focused on Daily Active Users (and You Probably Should Too)
Here’s something I learned the hard way: sign-ups mean nothing if no one actually uses your product.
Back in my early days as a product owner, we hit a big sign-up milestone and celebrated—only to find out most of those users never returned. That was a reality check.
It also made it clear why Slack never got too excited about sign-ups. They focused on one thing: Daily Active Users (DAU).
So, what exactly is a DAU?
Put simply, a Daily Active User is someone who logs in and actually uses your product to achieve their goal on a given day.
It’s not just someone who opened the app and bounced—they took an action that matters: sent a message, created a task, saved a file. You define what ‘active’ means based on your product.
DAU is usually calculated by counting the number of unique users who perform that action within a 24-hour window. It’s a much better signal of product stickiness than total traffic or sign-ups.
And it makes sense:
- A sign-up? That just means someone was curious.
- A daily user? That means they’ve built you into their routine.
Slack understood there was no middle ground. Teams either adopted it as a habit—or they didn’t. So they doubled down on DAU to figure out:
- Which features genuinely kept people engaged.
- Where onboarding was falling short.
- Whether they’d hit true product-market fit—when usage grows naturally, not just with marketing pushes.
How DAU Drove Product Decisions for Slack
This metric wasn’t just a report—it was a compass.
- They redesigned onboarding to get teams messaging faster.
- They tweaked notifications to balance urgency vs. annoyance.
- They built features like threaded replies and shared channels to deepen engagement.
Every decision tied back to one question: “Will this make people use Slack daily?”
The Essential SaaS Metrics Every PM Needs to Track
As a Product Manager, your dashboard is your cockpit. But with so many metrics flashing at you, which ones actually matter?
After analysing dozens of successful SaaS companies, I’ve distilled the only metrics worth tracking—the ones that directly tie to growth, retention, and revenue.
Let’s break them down.
A) Acquisition Metrics: Turning Strangers Into Users
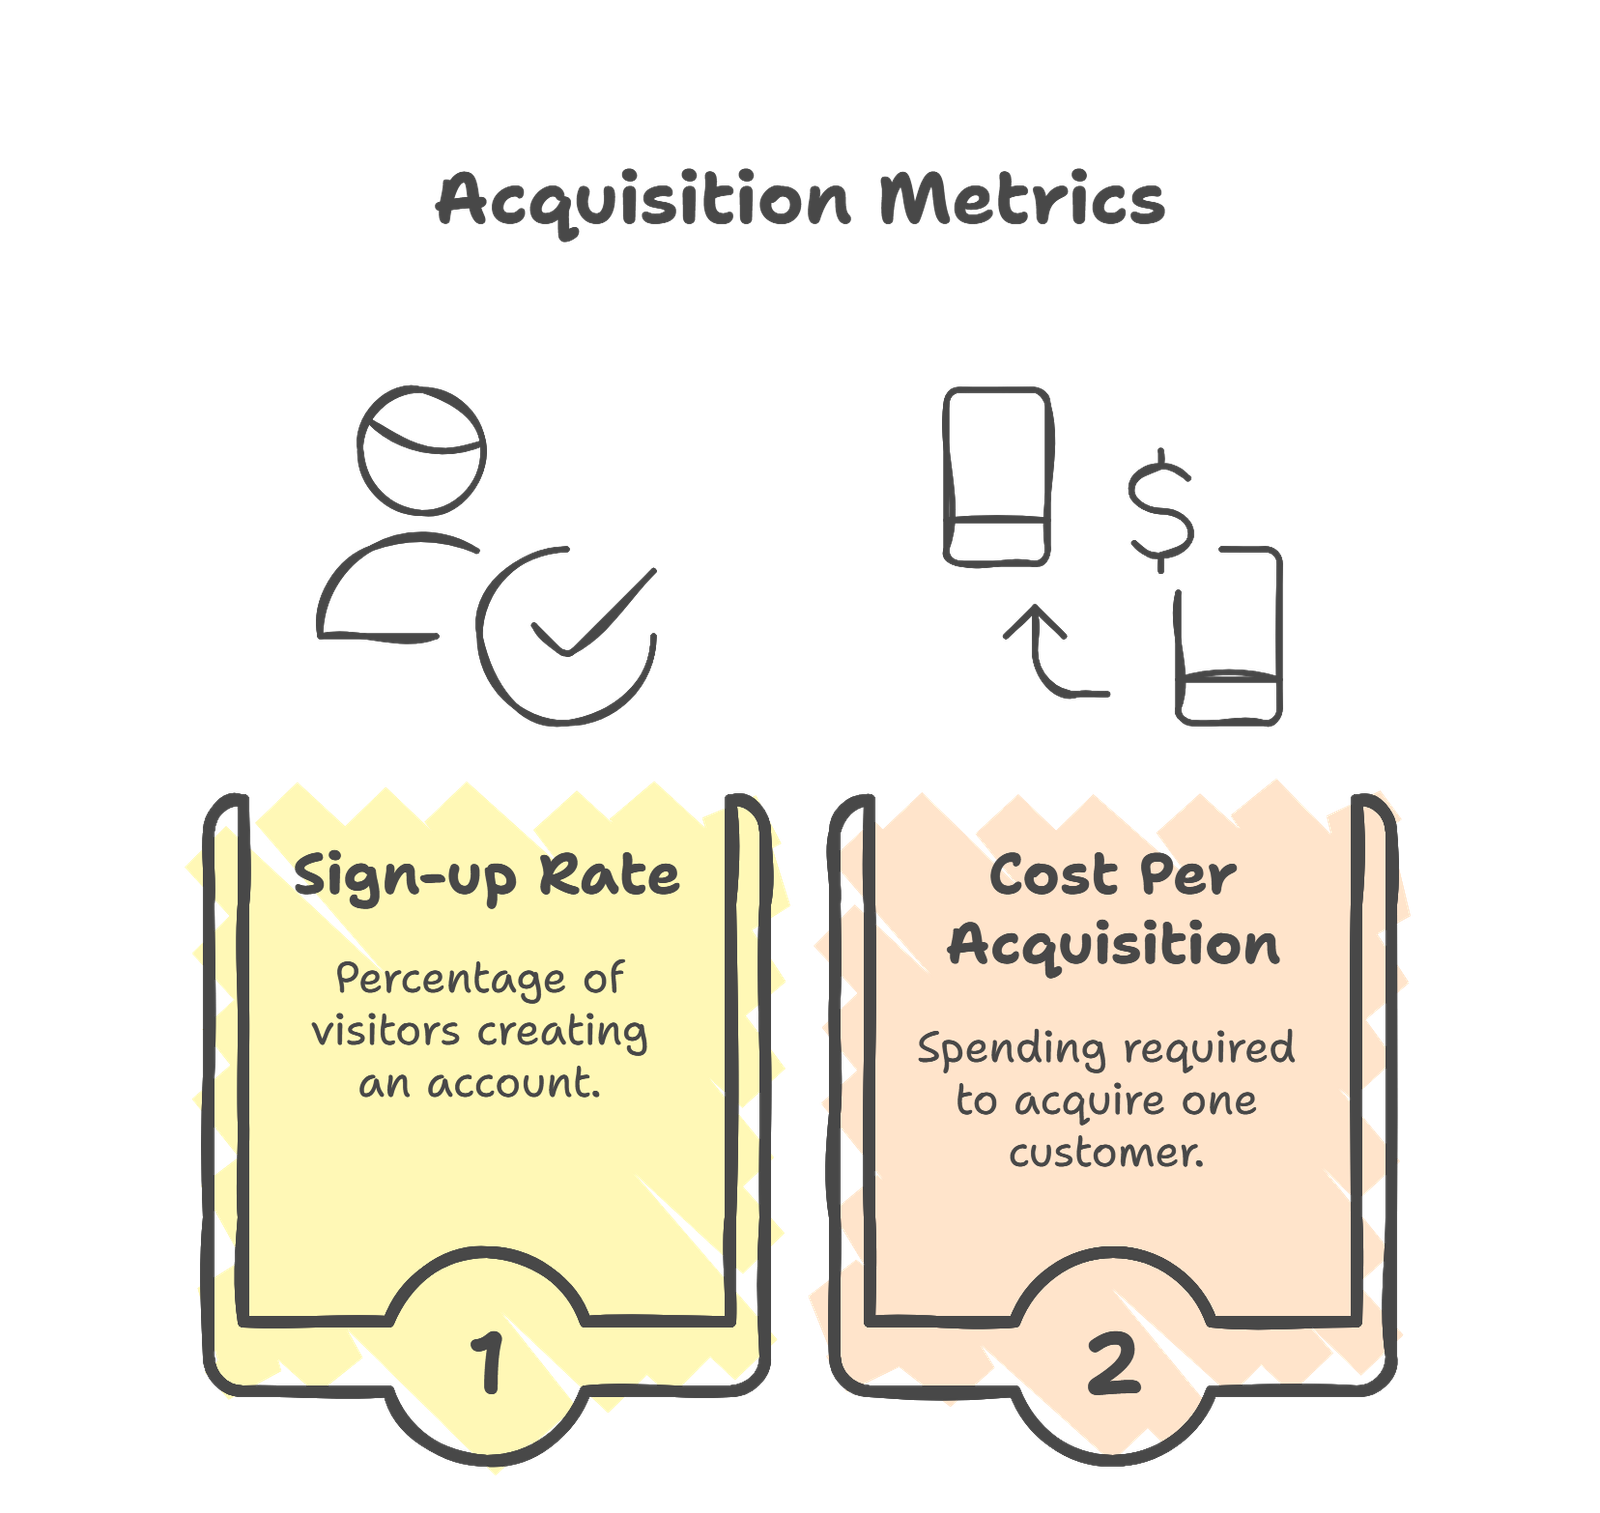
A-1) Sign-up Rate
Definition:The percentage of visitors who create an account.
Why it matters: It’s your top-of-funnel health check. A low sign-up rate means your messaging or UX is broken.
How to calculate:
Sign-up Rate = (Number of Sign-ups / Total Visitors) × 100

Example:
Visitors: 1,000
Sign-ups: 50
Sign-up Rate: (50 ÷ 1,000) × 100 = 5%
Real-world Example
Dropbox boosted sign-ups by 10% just by adding a simple explainer video to their homepage. The video did one thing really well: it showed visitors exactly how Dropbox could solve their file-sharing problems in real-world scenarios.
This small tweak cleared up confusion and made the product’s value instantly clear, which led to more sign-ups. It’s a great reminder that sometimes the simplest changes—like showing, not just telling—can have a huge impact on growth.
A-2) Cost Per Acquisition (CPA)
Definition: How much you spend to acquire one customer.
Why it matters: If CPA exceeds customer lifetime value (LTV), you’re burning cash.
How to calculate:
CPA = Total Marketing Spend / Number of Customers Acquired

Example
Marketing spend: £5,000
New customers: 200
CPA= £5,000 ÷ 200 = £25 per customer
Real-world example:
HubSpot realised paid ads were eating into their margins—and they quickly flipped the script.
The Problem: Paid Ads Were a Ticking Time Bomb
- Rising CPA threatened LTV:CAC ratio
- Every new customer cost more than the last
- Unsustainable for a subscription business
The Pivot: Betting on Organic
HubSpot went all-in on SEO and content, using their own tools to:
- Publish useful content
- Blog posts that solved real problems (not just keywords).
- Guides, templates, and tools that earned backlinks..
- Optimise for conversion, not just traffic
- Every piece tied to a clear next step (demo, trial, download)
- A/B tested CTAs relentlessly.
- Turn their CMS into a growth engine
- Used HubSpot’s own analytics to track what moved the needle.
- Doubled down on what worked, killed what didn’t.
The Results
- Built a moat (competitors couldn’t outbid them for SEO real estate)
- CPA dropped 30% (more customers, same spend)
- Higher-quality leads (organic searchers = more intent)
B) Activation & Engagement Metrics: Are Users Hooked?

B-1) Activation Rate
Definition: The % of users who hit their “aha moment” (e.g., first key action). That shows they’ve understood the core value of your product.
Why it matters: If users don’t activate, they’ll churn.
How to calculate:
Activation Rate = (Users Who Completed Key Action / Total Sign-ups) × 100

Example:
If 500 out of 1,000 sign-ups complete your key action (e.g., setting up a profile or making their first post):
Activation Rate = (500 ÷ 1,000) × 100 = 50%
Real-world example:
Twitter found that users who followed 5+ accounts in their first week were far more likely to stay.
B-2) Daily/Monthly Active Users (DAU/MAU)
Definition: Users who engage daily (DAU) or monthly (MAU).
Why it matters: Measures habit formation—the core of sticky products.
How to calculate:
DAU = Unique Users Active in a Day
MAU = Unique Users Active in a Month
Stickiness = (DAU / MAU) × 100

Example:
You have 10,000 MAUs and 2,000 DAUs:
Stickiness = (2,000 ÷ 10,000) × 100 = 20%
1 in 5 users comes back daily—a solid sign of engagement.
Real-world example:
Slack didn’t chase sign-ups—they tracked who showed up every single day, because that’s where product stickiness lives.
The Stickiness That Changed Work Forever
- 42 million people used Slack every single day—not because they had to, but because work stopped without it.
- A DAU/MAU ratio above 50% meant more than half of monthly users were daily addicts.
- 90 minutes per day—longer than most social media sessions—proved Slack wasn’t just a tool, but a workplace reflex.
Why This Metric Mattered More Than All Others
- It exposed real dependency
- Teams at IBM, Amazon, and Airbnb didn’t adopt Slack—they required it.
- Email volume dropped 32%, meetings 27%—because Slack became the new default.
- It fueled self-sustaining growth
- New hires onboarded themselves (“Add me to the channels”).
- Competitors (Microsoft Teams, Google Chat) were forced to copy Slack’s UX, not the other way around.
- It justified a £27.7 billion exit
- Salesforce didn’t buy a messaging app—they bought the daily habit of millions.
- DAU proved Slack was systemically important to modern work.
C) Retention & Churn Metrics: Keeping Users for Life

C-1) Customer Retention Rate
Definition: The % of customers who stay over a period.
Why it matters:
- Cost-effective: Retaining customers is 5–25x cheaper than acquiring new ones.
- Easier sales: Existing customers buy more often with personalised engagement.
- Higher revenue: Their repeat purchases boost lifetime value, with 60–70% conversion rates vs. 5–20% for new leads.
How to calculate:
Retention Rate = ((Customers at End of Period - New Customers) / Customers at Start) × 100

Example:
You start the month with 100 customers.
You gain 30 new ones and end the month with 110.
Retention Rate = ((110 − 30) ÷ 100) × 100 = 80%
Real-world example:
Amazon Prime’s Retention Masterclass
Prime retains 99% of members after two years.
How?
- Shared Value:
- Family plans turn one subscription into a household habit.
- More users = harder to cancel (“Mom uses it!”).
- Embedded Benefits:
- Free shipping + Video + Music = multiple reasons to stay.
- Frictionless Renewal:
- Auto-renewal + perceived value = “Why wouldn’t I keep it?”
C-2) Churn Rate
Definition: The % of customers who stop using your product in a set period.
Why it matters:
- High churn cancels out growth, no matter how good your acquisition is.
- It signals product, onboarding, or support issues that need fixing.
Churn Rate = (Customers Lost in Period / Total Customers at Start) × 100

Example:
You start the month with 200 customers.
By the end, 20 have canceled.
Churn Rate = (20 ÷ 200) × 100 = 10%
Real-world example:
Groove learned the hard way.
They were getting steady signups, but something was off. Behind the scenes, a 4.5% monthly churn rate was quietly eating away at their growth. Here’s what changed:
The breakthrough? They stopped guessing.
Instead of assuming why users were leaving, they tracked what actually happened in the first 10 days.
Two big red flags popped up:
- Most users had short first sessions—under 2 minutes.
- Login frequency was low. People weren’t coming back.
So they stepped in—early.
Groove started sending personalised emails to users who looked like they were getting stuck.
Not generic tips, but real, targeted help:
“Need a hand? We’ll walk you through setup.”
They met users where they were, based on actual behavior—not assumptions.
Then they made it part of onboarding.
Instead of waiting to rescue users who were about to churn, they built proactive support into the flow.
No more hoping users figured it out. They guided them early.
The results?
- 40%+ of those “saved” users stayed active past 30 days
- 71% drop in churn for key user segments
- And finally—growth that wasn’t just new users in, old users out
D) Revenue Metrics: The Lifeblood of Your Business
D-1) Monthly Recurring Revenue (MRR) & Annual Recurring Revenue (ARR)
Definition: The predictable revenue you earn from subscriptions—month after month (MRR) or year after year (ARR). It’s not one-off sales; it’s the steady income you can count on.
Why it matters:
- This is your growth heartbeat—MRR/ARR tells you if your business is actually growing, plateauing, or declining.
- It helps you plan with confidence: hiring, spending, and investing are all easier when you know what’s coming in.
- It gives you a clearer picture of product-market fit. If MRR is steadily growing and churn is low, you’re on the right track.
How to calculate:
MRR = Sum of All Monthly Subscription Revenue
ARR = MRR × 12

Example:
50 users on a £20/month plan = £1,000
10 users on a £100/month plan = £1,000
Then MRR = £2,000
ARR = £2,000 × 12 = £24,000
Real-world example:
In 2011, The New York Times did something radical: They put up a paywall.
Critics called it suicide. Readers threatened to leave.
The Subscription Shift
Here’s what actually happened when The New York Times doubled down on MRR and ARR:
The result?
- Value stacking drove retention and stickiness
- The more products people used, the harder it became to leave.
- They escaped the ad treadmill
- The focus moved from chasing clicks or feeding the algorithm to content people were happy to pay for.
- MRR gave them a real-time pulse
- They could track growth month by month and adjust quickly.
- ARR unlocked bold moves
- With stable income, they made big bets—like acquiring The Athletic for £550M.
- They built a powerful bundle
- By 2024, they hit 10.8 million digital subscribers—not just for news, but for Games, Cooking, Wirecutter, and more.
D-2) Average Revenue Per User (ARPU)
Definition: Revenue generated per customer.
Why it matters:
- Helps to improve pricing tiers.
- Shows if users are upgrading, downgrading, or if certain segments bring in more value than others.
How to calculate:
ARPU = Total Revenue / Number of Paying Users

Example:
If you made £10,000 in a month from 200 paying users:
ARPU = £10,000 ÷ 200 = £50
On average, each paying user brought in £50 that month.
Real-world example:
In its early days, Spotify had plenty of users—but their revenue value varied wildly:
- Free users (ad-supported)
- Premium subscribers (full price)
- Discounted plans (Family, Student—great for retention, not great for revenue per person)
The real shift came when Spotify stopped chasing sign-ups and started tracking how much each type of user was actually worth.
Here’s what they did:
Optimised the mix: Instead of just growing user count, they focused on shifting the right users into higher-value buckets. ARPU rose—even without huge spikes in user growth.
Followed the money: Premium users brought in significantly more revenue per person than free users relying on ads.
Refined their upgrade strategy: Free users got trial offers based on listening habits. Solo subscribers were nudged toward Family plans. Advertisers got better targeting to lift ad revenue.
E) Expansion & Referral Metrics: Growing Without Burning Cash
E-1) NPS (Net Promoter Score) – The Ultimate Loyalty Litmus Test
Definition: NPS measures how likely your customers are to actively recommend your product to others on a 0-10 scale.
Why It Matters:
- Predicts growth: Promoters (9-10 scores) drive 80% of referrals
- Exposes risks: Detractors (0-6) are churn bombs waiting to explode
- Benchmarks performance: Compare against industry standards
How It Works:
- Ask: “How likely are you to recommend us to a friend?”
- Categorise:
- Promoters (9-10): Your evangelists
- Passives (7-8): Satisfied but indifferent
- Detractors (0-6): At risk of leaving (or worse, bad-mouthing you)
How to calculate:
NPS = % Promoters (9-10) - % Detractors (0-6)

Example:
Survey of 100 users:
50% are Promoters (rating 9-10).
30% are Passives (rating 7-8).
20% are Detractors (rating 0-6).
NPS = 50% (Promoters) - 20% (Detractors) = +30.
+30 means good customer satisfaction and loyalty.
Real-world example:
Let’s talk about the product so good it sold itself.
Back in 2013, scheduling meetings was a universal productivity killer-coordination hell, endless back-and-forth emails, the whole circus. Then Calendly showed up with a simple fix, and something wild happened:
Users Didn’t Just Like It-They Preached It
- Colleagues encouraged colleagues to use it.
- Recruiters preferred candidates to book through it.
- Teams adopted it bottom-up, without a manager’s mandate.
For years, Calendly’s NPS hovered around 70—an exceptional score for customer loyalty in SaaS. More recently, it’s settled closer to 50, still ahead of most competitors and a clear sign that users are satisfied enough to spread the word.
Why NPS Was Their Secret Weapon
- It exposed the viral engine
- 70% of new signups came from existing users’ links
- CAC dropped because customers were the sales team.
- It guided product decisions
- Feedback from Promoters (9-10 scores) doubled down on what worked.
- Detractor (0-6) complaints highighted real friction points for improvements.
- It made growth self-sustaining
- No expensive ads—just happy users recruiting more happy users.
- Churn stayed low because the product earned its place in workflows.
E-2) Virality Coefficient
Definition: How many new users each customer brings in on average.
Why it matters:
- Organic growth > paid growth: If users naturally share/invite others, you’ve built a self-sustaining engine
- Compounding returns: 100 users bringing in 1 friend each becomes 200, then 400, then 800…
- Product-market fit signal: Viral spread means people want to bring others in
How to calculate:
Virality Coefficient = (Number of Invitations Sent × Conversion Rate) / Existing Users
Example:
If each user sends 5 invitations and 20% of those invited users sign up, the viral coefficient is:5×0.2=15×0.2=1
This means every user brings in one new user, creating a viral loop
Key Points
- Viral coefficient > 1: Exponential growth—your product spreads fast.
- Viral coefficient < 1: Growth isn’t viral; referrals won’t keep your user base growing on their own.
Real-worl example
In 2008, Dropbox made a game-changing move: they transformed cloud storage into a social currency. Here’s how they engineered virality:
The Game-Changing Mechanics
- Dual-sided rewards:
- Inviter: “Get 500MB free!”
- Invitee: “You get 500MB too!”
No losers—everyone wins.
- Frictionless sharing:
Sharing was built directly into the file-sharing experience. No forms, no coupon codes—just click, share, and get rewarded.
The Numbers that Shifted Everything
- The average user sent 4 invites.
- They had a 50% conversion rate.
- Result? A viral coefficient of 2.0—every user brought in two more.
The Explosive Growth
- 100,000 to 4 million users in just 15 months.
- 70% of sign-ups came through referrals.
- Customer Acquisition Cost (CAC) plummeted to nearly zero.